Welcome to the new Engineering Journal. This post serves as both a welcoming entry and a technical showcase of the capabilities integrated into this documentation engine. Every element here is designed for precision, clarity, and ease of technical communication.
This journal is more than a blog; it is a structured technical archive. It supports automatic numbering for equations and figures, IEEE-style citations, and high-performance server-side diagrams.
Technical Typography
The foundation of any engineering document is clear typography. We use a combination of Inter for prose and JetBrains Mono for technical tokens.
Inline Formatting
Prose can include inline code snippets, strong emphasis, and italicized technical terms. We also support text highlighting for critical observations and Key + Combinations for interface instructions.
Code & Syntax Highlighting
Powered by Shiki, our code blocks support dual-theme syntax highlighting, line numbers, and specific line focus.
export async function getPosts(dir: string) {
  const files = await fs.readdir(dir);
  // The following line is highlighted for focus
  return files.filter(f => f.endsWith('.mdx'));
}
For shell commands and build logs:
npm install
npm run build
Mathematical Precision
For research and control engineering, LaTeX support is essential. We use KaTeX for server-side math rendering.
The PID Control Law
A classic example of control implementation in the time domain:
Stability Analysis
Inline math like flows naturally with the text, ensuring a smooth reading experience for theoretical derivations.
System Diagrams
Visualizing architecture is handled via Mermaid.js, rendered to static SVG during build time to ensure zero client-side overhead.
Data & Benchmarks
When presenting research data, clarity is paramount. We provide specialized grid components for both qualitative and quantitative data.
Performance Metrics
Technical Comparison
| Feature | Implementation | Performance |
|---|---|---|
| Markdown | GFM Extensions | Build-time |
| Math | KaTeX | Server-side |
| Syntax | Shiki | Dual-theme |
| Diagrams | Mermaid | Static SVG |
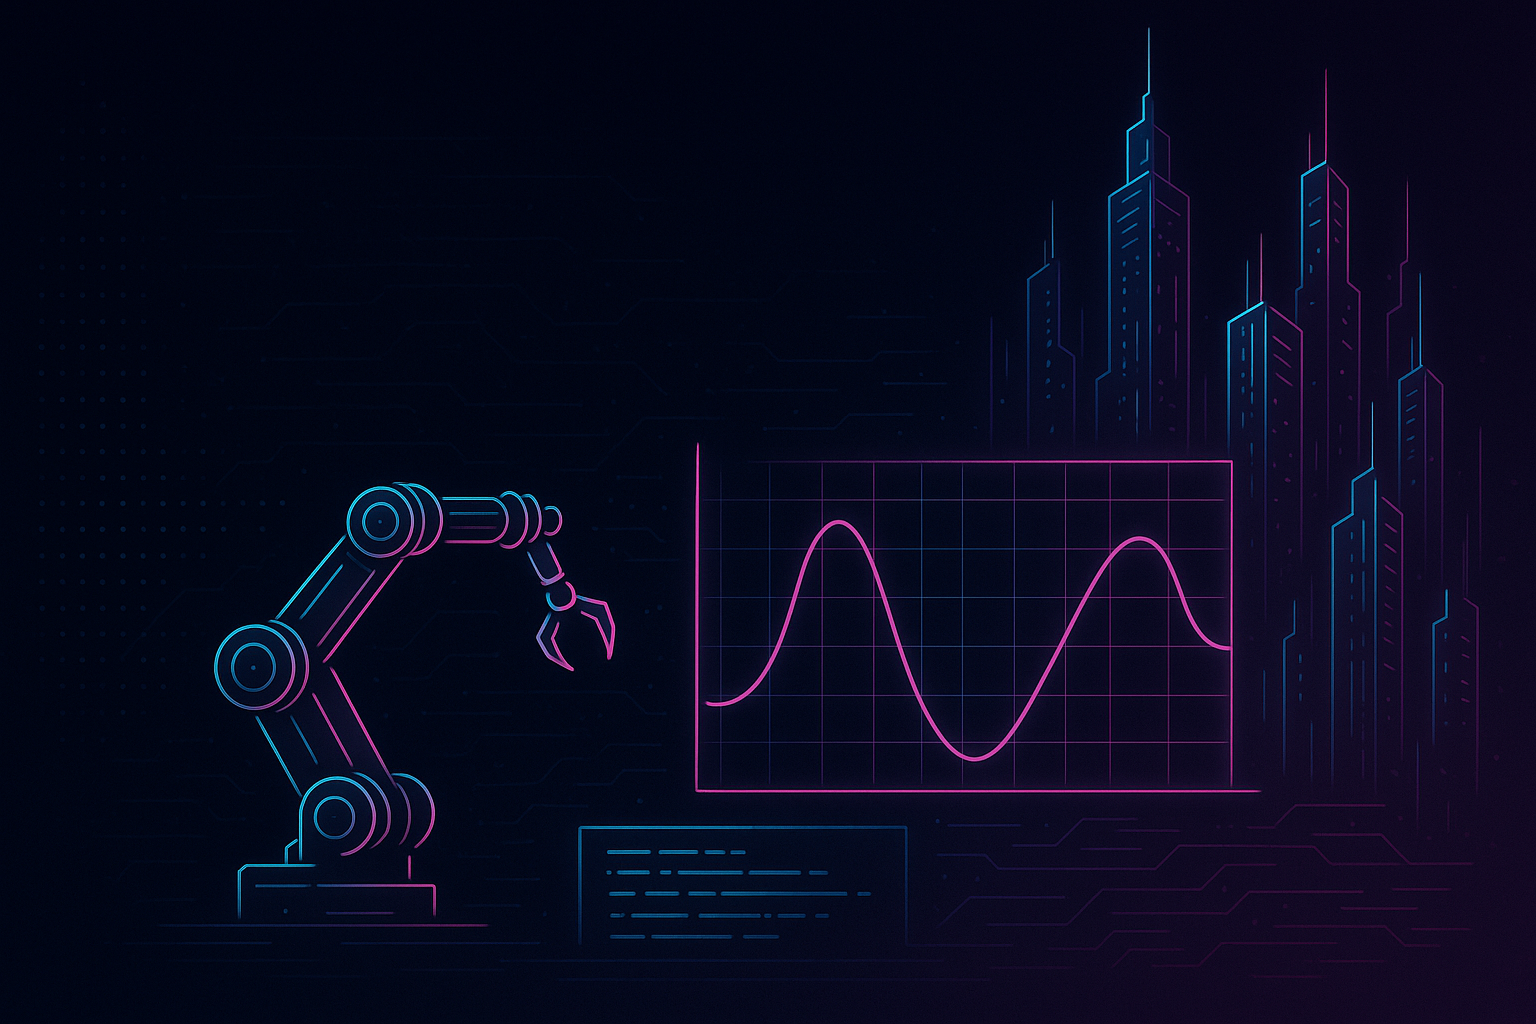
Media & Visuals
High-resolution imagery and figures are automatically numbered and labeled for cross-referencing.
Citations & References
Academic integrity is maintained through a structured citation system [1]. This allows for deep technical dives [2, 3] while honoring the original research and standards.
References
- [1]I. Putra, Advanced Control Strategies for Robotic Systems, University of Engineering, 2025.
- [2]J. Doe et al., "The Impact of MDX in Technical Documentation," Journal of Software Engineering, vol. 12, no. 4, 2024.
- [3]IEEE Standard for Technical Reviews and Audits, IEEE Std 1028-2008.